Once was a Smart State: Intellectual Leaders in Queensland
1859-1989
A Typology of Thinkers and their Interrelation in Queensland History
Models and Maps
In the project a range of models or maps will be used to explain the interrelations between Queensland thinkers. I am using the terms ‘models’ and ‘maps’ concurrently. When one considers a model, such as a matrix graph, it only requires a perception of the relationships between the locations displayed to reveal a mapping component. Equally, a mapping diagram has a modelling quality in grouping kinds of entities together. The abstraction often conflates the idea of a model and a map, even while examples of a ‘pure’ map or a ‘pure’ model can be found. Hence, I will not force any categorical distinction for this section of the project.
The following models and maps have been developed:
[updated 25 September 2014]
IAR Diagram. Licensed under Free Art License via Wikimedia Commons.
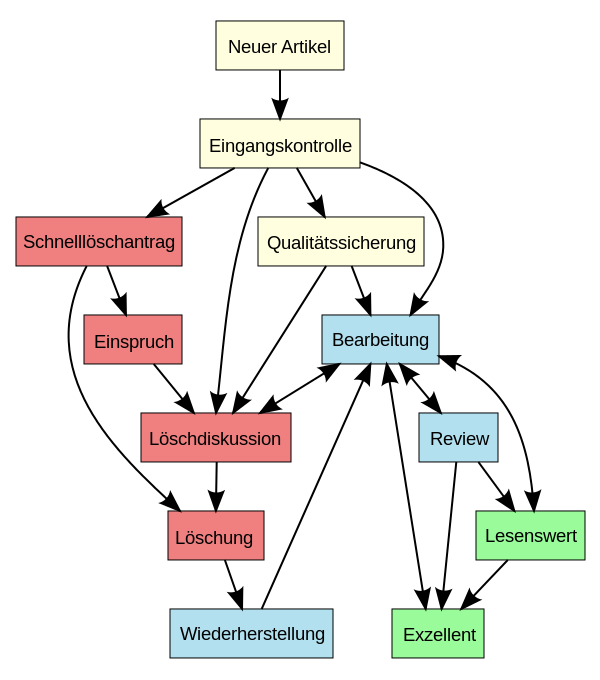
Wikipedia-Organigramm